Vanity Fair have a great synopsis and article on Microsoft and their fall from the top, but not for the reasons I've looked at.
Since the early 1990's I've thought that Roger's Diffusion of Innovation and Christensen's Theory of Disruptive Innovation models of Technology product life cycles is best explained with 3 main exponential curves: Growth, Maturity, Decline, and two minor exponential curves: the 'prequel' and 'long tail'. There are different strategies to make money as a vendor and technology support person in all phases. In the Growth phase there is a chronic under-supply of competent consultants and rates are sky-high and training courses are crammed, which all falls apart suddenly when Market Maturity sets in. The Decline and 'long-tail' phases are full of opportunity for those willing to be "The Few" to support the old technology, but you have to be expert and be known through the user networks.
It took me a while to realise that the Decline was the inverse of the Next Big Things' Growth phase: economic substitution at work.
This was the thinking behind my 2006 observation that Microsoft was at the top of their game and were going into Decline.
But I could never figure how to show this - none of the figures and graphs I found supported this.
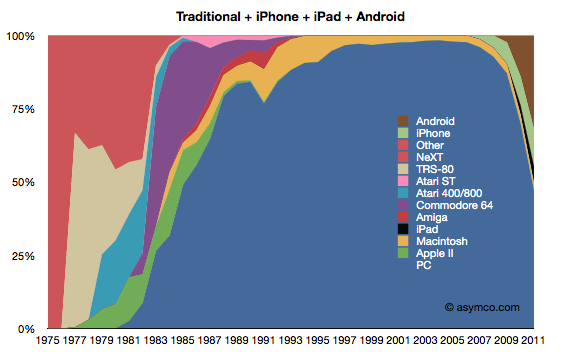
Until asymco's Horace Dediu's piece on The Rise and Fall of Personal Computing, that is.
He's got a great graph that's gone viral in that piece.
He plots Market Share over time of all Compute Appliance Markets and for PC's it seems to show an exponential Growth phase from 1980-1995 (with a little blip), a Mature Market phase with slower exponential growth, and starting around 2005/6, an exponential decay that looks like share has fallen off a cliff.
This makes sense: sales of Microsoft product weren't stopped by smartphones and tablets, but they were affected a little.
New entrants with new product categories aren't initially direct competitors/substitutes, though existing sales are affected.
The whole market increases because a new category (or dimension) is added: like smartphones, then tablets.
So sales of existing products and categories don't show much change because all the action is taking place elsewhere - in the new categories which, by definition, aren't reported in old products.
This is the first time I've seen anything close to supporting the exponential nature of the Technology life-cycle.
Why exponential? Because growth and adoption are word-of-mouth via networking effects yielding a CAGR: Compound Annual Growth Rate.
So my sincere thanks to Horace for hard data and a great graph.
No comments:
Post a Comment